Methods of iterating | JAN.14-FEB.7
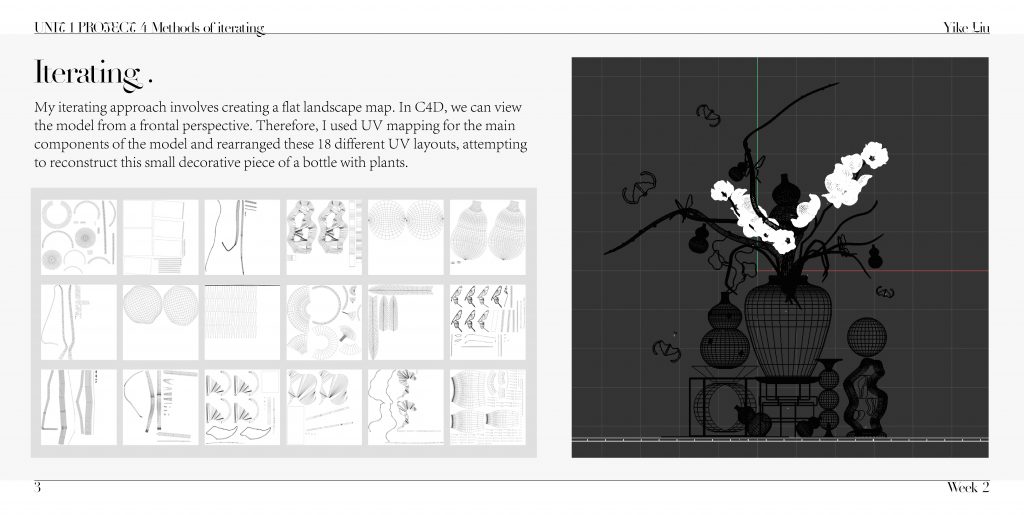
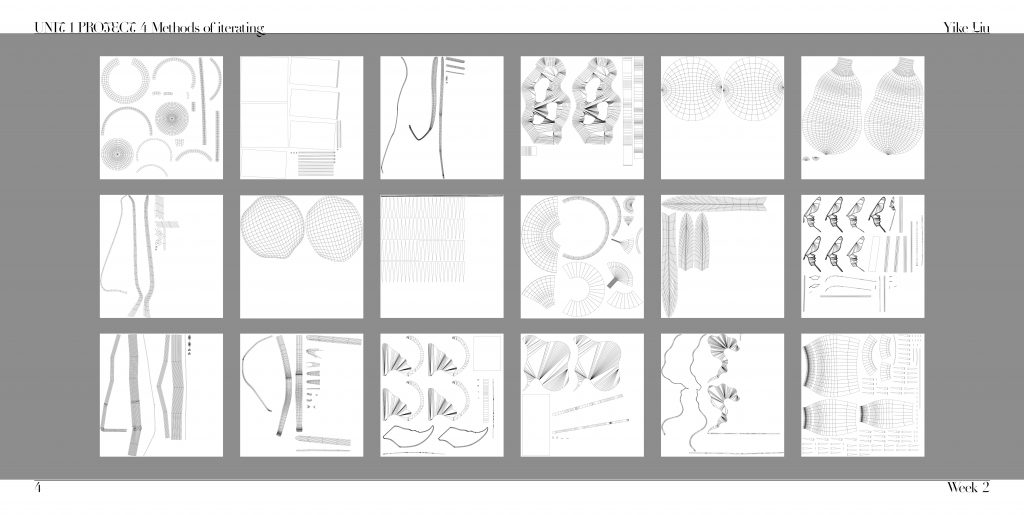
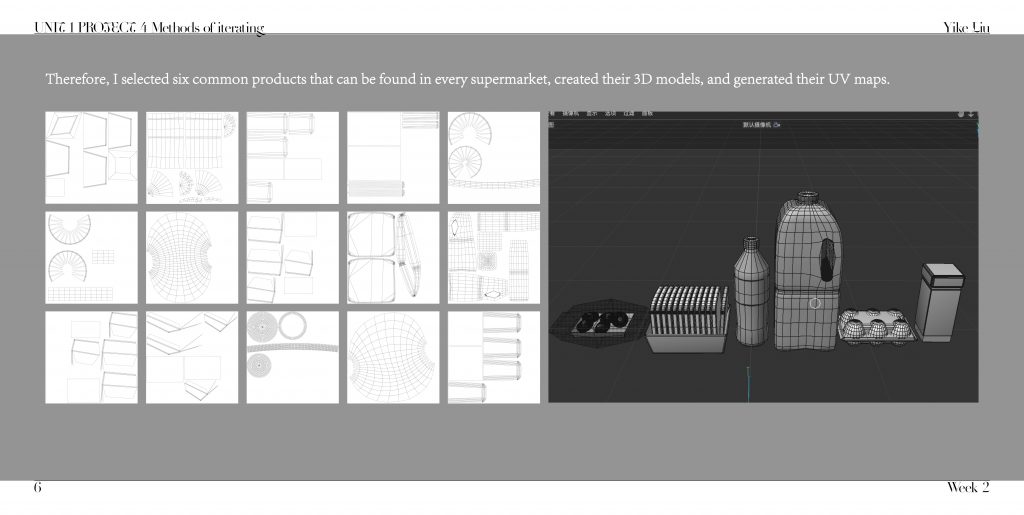
These are the 18 UV layouts below. Some of them are distorted, so I wanted to further rearrange their positions based on these UV maps to make them look more like the original model.
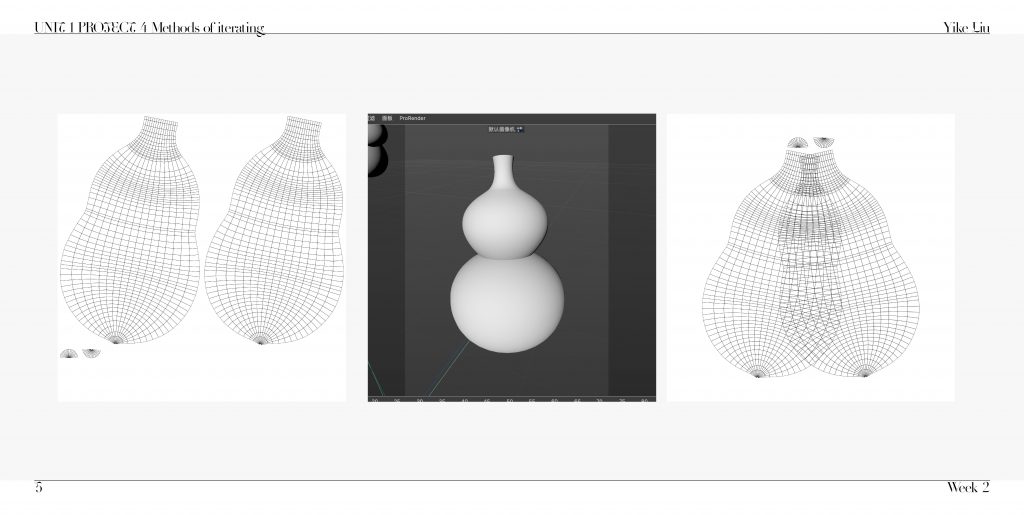
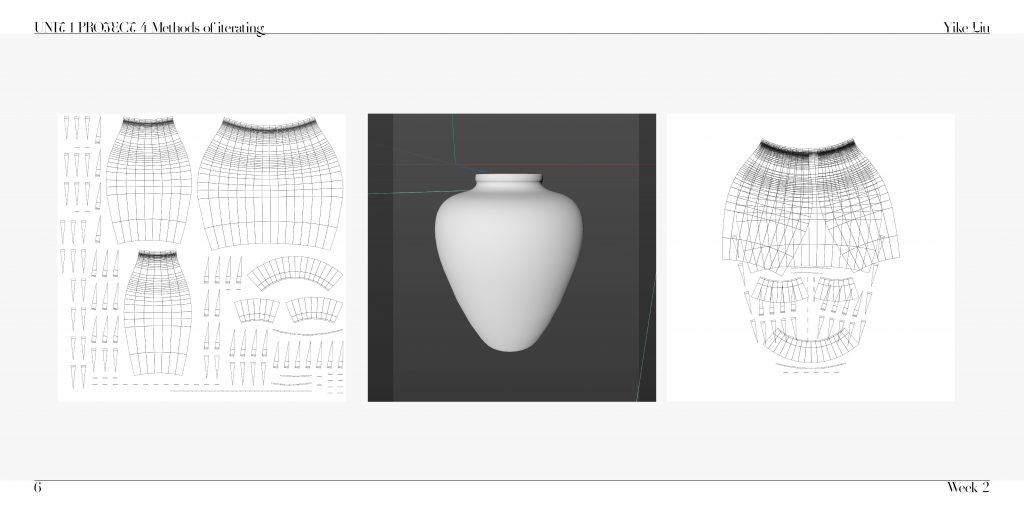
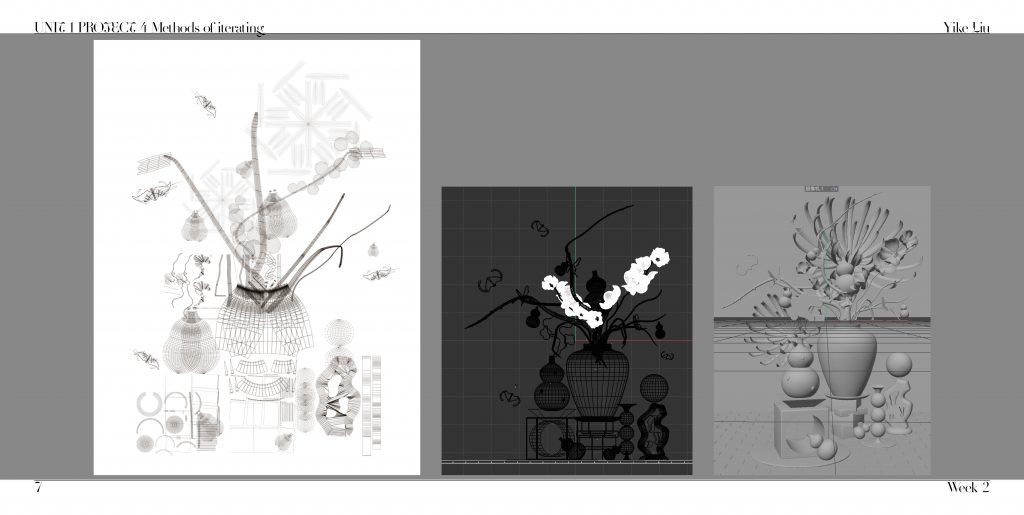
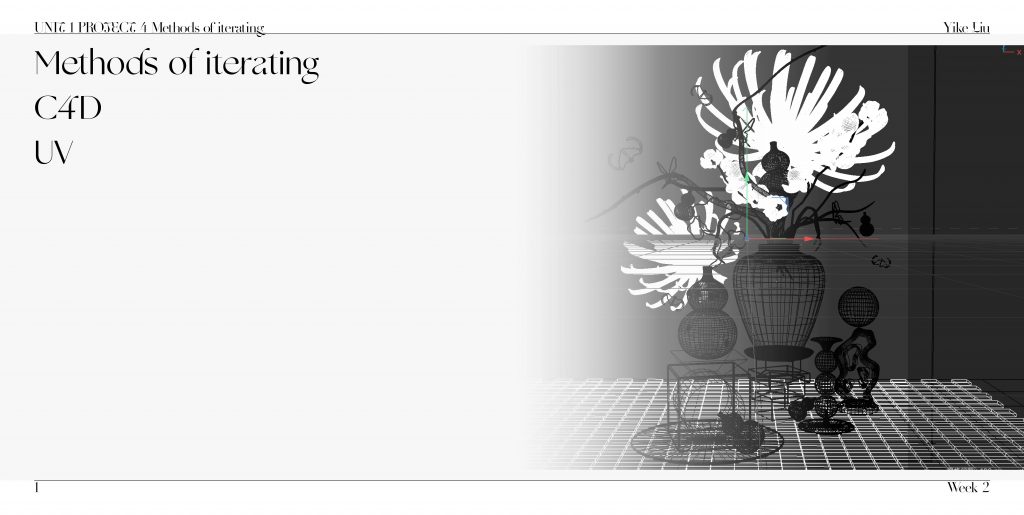
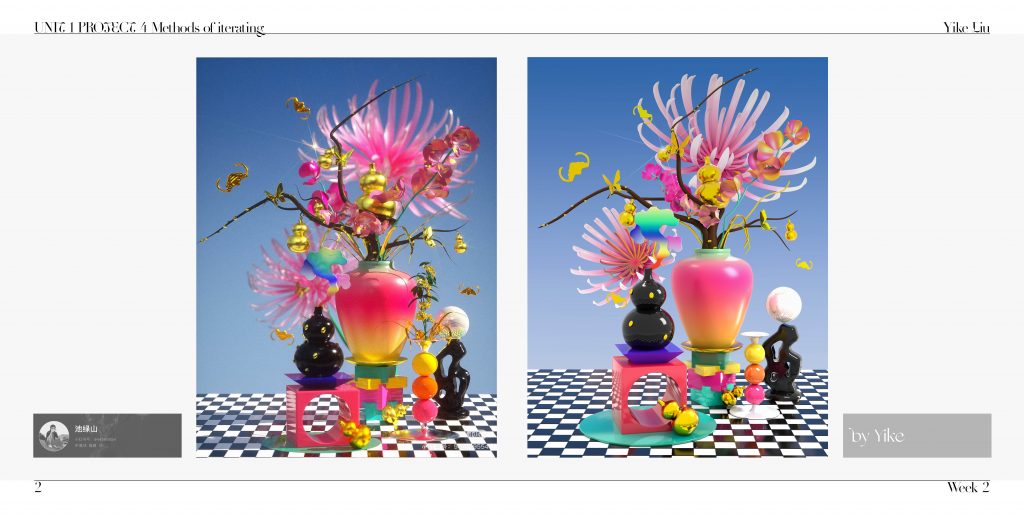
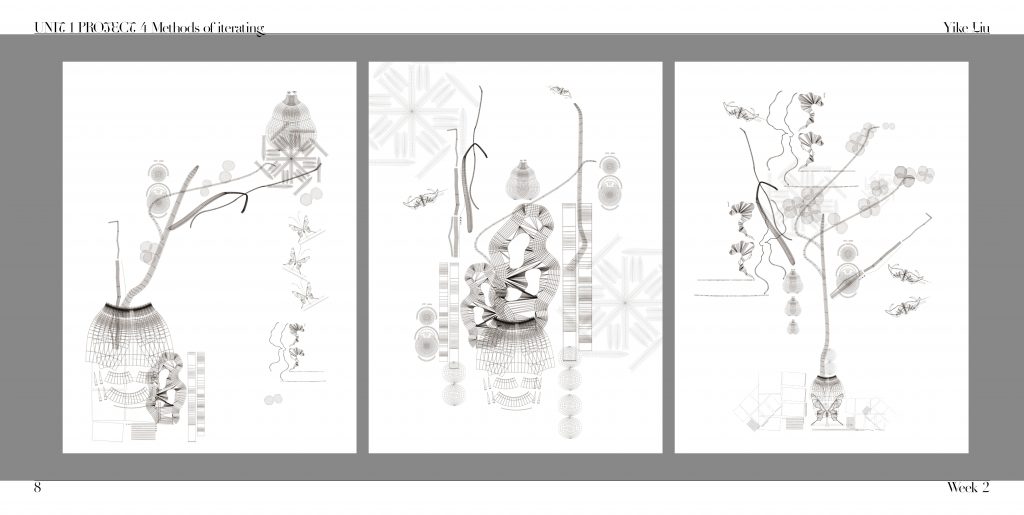
I rearranged these 18 UV layouts and restored their positions based on the frontal view of the model. In doing so, I got a 2D image of the 3D model. When I made this image, I found the combination of 2D and 3D quite interesting. So, I continued to create three similar images.
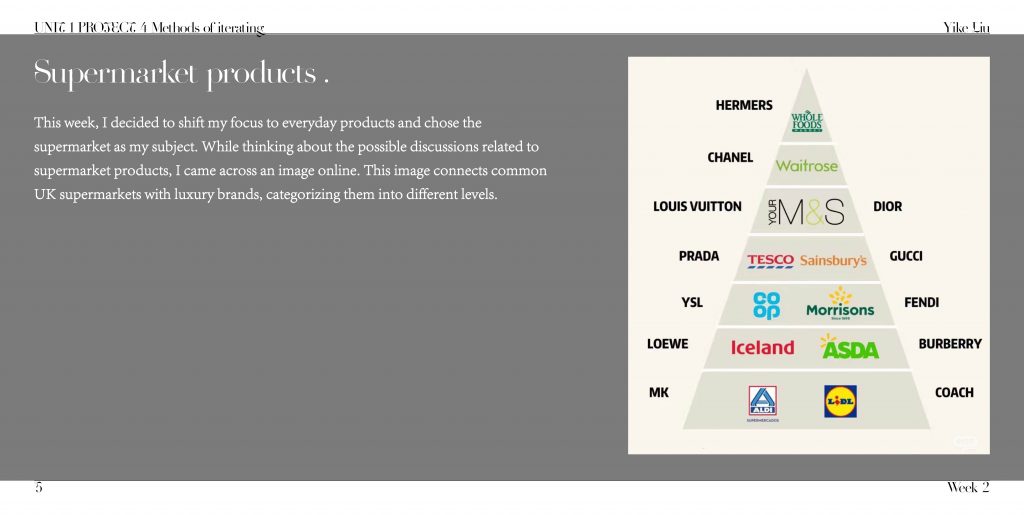
This week, I shifted my focus to supermarkets. When thinking about what these supermarket products could represent, I came across this image online. It compares UK supermarkets to luxury brands, ranking them from high-end to low-end.
I found this image very interesting. It made me think about why people classify supermarkets like this. The products themselves are no different, bread is still bread, milk is still milk.
But people attach labels to supermarkets, linking them to different social classes. These labels work like UV maps: if we remove the UV, the products remain the same—they are just ordinary bread, cola, and eggs. The idea of ranking comes from human perception and marketing, not the actual products.
So, I wanted to express this idea using UV maps.
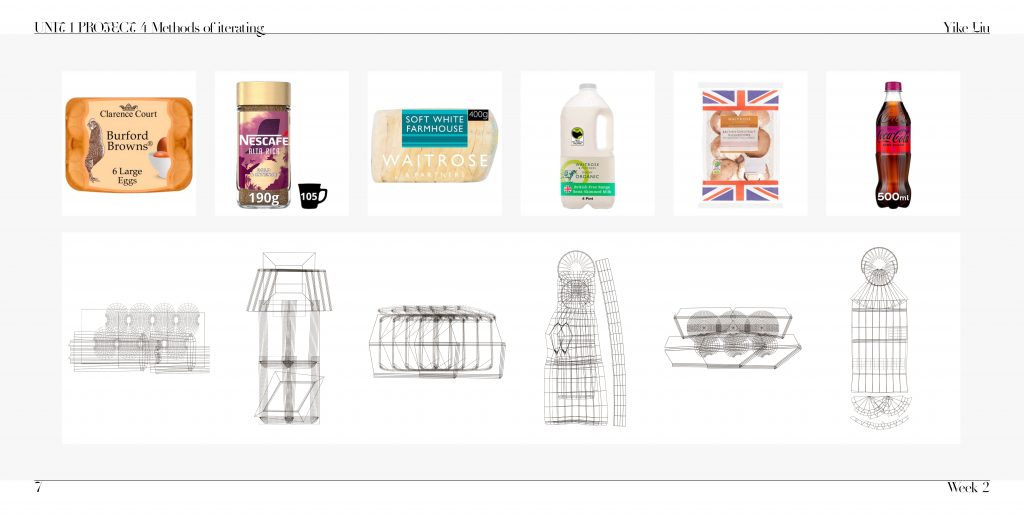
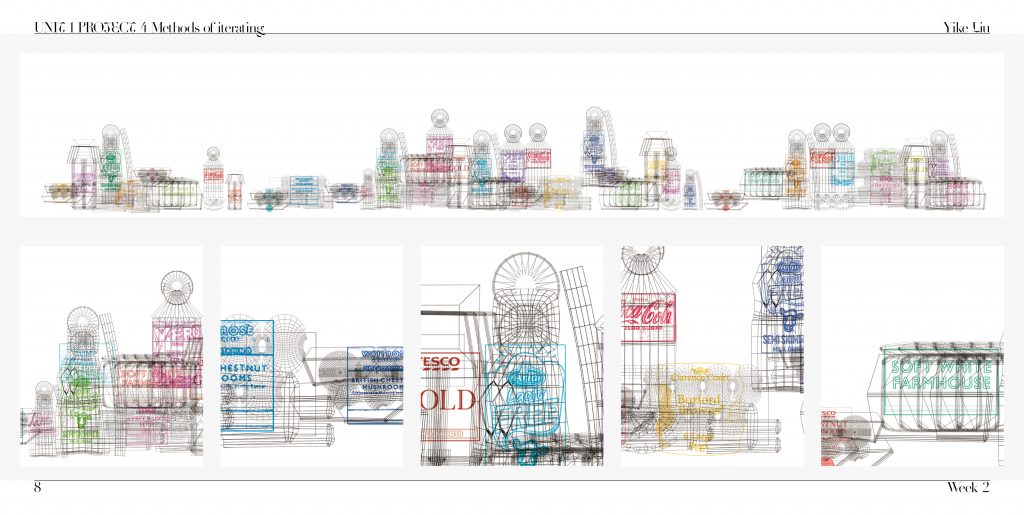
last, I created a front view of a long dining table. On each product, I applied packaging from different supermarkets. This highlights how labels separate products into different price levels—there have “expensive” bread and “cheap” bread. But when you step back and look at the full image, you stop noticing the packaging and just see bread. The image is simply a dining table—there is no hierarchy.
Leave a Reply